原文链接:https://pubmed.ncbi.nlm.nih.gov/36740976/
在类人猿大脑中,丘脑枕复合体(pulvinar complex)是多个核团亚区的统称。根据组织化学染色的方法,丘脑枕中主要包括三个分区:中部丘脑枕(PM)、外侧丘脑枕(PL)、后侧丘脑枕(PI)。虽然目前已有大量基于解剖学手段得到的丘脑枕与其他皮层区域的大致连接拓扑样式,但是丘脑枕与经典视觉通路(腹侧流和背侧流)的关系仍然有尚未完全理解的部分。目前,研究人员认为丘脑枕的PL和PI中包含有两个清晰的与视觉地图相关的视网膜拓扑结构,因此本实验中对于应该观察到的连接样式具有明确的预期。本研究的目的是确定INS-fMRI技术具有显示拓扑状功能连接的能力,并进一步揭示该方法在其他研究方向中潜在的优势。
本实验主要展示了在同一个丘脑枕中,通过一系列的刺激位点来揭示丘脑枕不同亚区与视皮层区域的拓扑状连接样式的差异性。在图2示例中,展示了三个位于同一个穿刺通道下,不同刺激深度的刺激位点(如红点所示)。通过对比Gattass等人建立的丘脑枕视觉地图,可以得出每个刺激位点在视觉地图中的位置(图2A-B)。图2C展示了冠状视图下的MRI图像,可见三个刺激位点均在视皮层区域中引起较强的BOLD反应,并且不同刺激位点所引起的聚集性反应处在不同的位置。为更加直观地展示BOLD反应在视皮层的视觉地图中所处的位置,本实验中重构了经摊平处理后的视皮层区域,并将BOLD反应像素投射到该摊平的视皮层上。该方法可以清晰地看到不同刺激位点在视皮层中引起的反应是非常局部并且符合拓扑状分布的(图2D);通过调整显著性阈值,可以进一步确定不同反应区域的中心位置,并且依然符合拓扑样分布。本实验还关注了更高级的视皮层:MT及其周围区域(MST/FST/V4t),结果发现MT区域与腹侧丘脑枕区域之间具有不同的连接样式,并且上述两个区域之间的拓扑状连接样式与早期视皮层区域的连接样式相一致(图3)。整体来看,当刺激位点稍微移动后,视皮层中的反应也随之发生拓扑状的移动。统计结果表明,PL更倾向与腹侧流的视觉通路连接,而PI则倾向与背侧流的视觉通路连接(图4)。
本文的研究结果表明,INS刺激所引起的功能性连接样式在很大程度上与早期发现的解剖学连接样式是一致的,因此也证明该方法对于研究功能连接环路的可行性。本实验也拓展了对丘脑枕与皮层区域功能连接的认识,更重要的是,也为将来在全脑范围内研究丘脑-皮层的功能连接提供可能性。

图1. 丘脑枕中所有刺激位点的分布情况。本实验中,共在两只恒河猴的两个丘脑枕中的28个不同的位点进行了激光刺激。

图2. 视皮层中BOLD反应示例图。A:通过组织学染色确定刺激位点所处丘脑枕亚区。B:早期Gattass等人构建的丘脑枕视网膜拓扑图,对比图A可知:位点11位于下视野区域,靠近水平子午线的40°偏心角位置;位点12位于下视野区域中10-20°偏心角位置;位点13位于下视野的中央凹区域。C:MRI冠状视角中展示BOLD反应分布情况。D:在重构的摊平的视皮层中展示BOLD反应:位点11引起的反应主要位于外周视野,并靠近水平子午线;位点12引起的反应主要位于10-20°偏心角位置;位点13引起的反应主要位于下视野的中央凹区域。

图3. MT及其周围区域的BOLD反应分布情况

图4. 丘脑枕中不同亚区的刺激在视皮层中所引起反应的统计分析
浙江大学系统神经与认知科学研究所Toru Takahata教授与Anna Wang Roe教授为共同通讯作者;姚松坪与史孙航为共同第一作者,周秋盈,王剑葆,杜潇为共同作者。本研究得到国家重点研发计划项目、国自然基因项目等的支持。
Link:https://elifesciences.org/articles/81794
Spatial frequency (SF) is an important attribute in the visual scene and is a defining feature of visual processing channels. Previous studies have shown that the organization of SF selectivity is related to orientation and color maps in the primary visual cortex (V1) and have a high degree of periodicity in both cats and monkeys. Studies have consistently shown an orthogonal mapping of SF and orientation, suggesting an efficient arrangement that provides each orientation access to a wide range of SFs. In contrast, color representation in V1 (the color is represented in patches commonly referred to as 'blobs' in V1) is generally associated with a range of lower SFs. Thus, in addition to a gradient from high to low of SF representation across eccentricities, SF organization is further specified within local distinct functional regions. This systematic architecture in V1 suggests that SF may be a fundamental feature of the cortical ‘hypercolumn’ (see Figure 1).

Figure 1. Illustration of proposed hypercolumn (including spatial frequency [SF], color, and orientation domains) in the visual cortex.
(A) As eccentricity decreases from parafoveal to foveal region, the preferred SF gradually increases (represented as the brightness of the short bar).
(B) Details of structure in a single hypercolumn. In this local region, color domains (orange area) and orientation domains (blue area) exhibit different relationships with SF domains (light gray region: low SF preference domain; dark gray region: high SF preference domain). Orientation maps orthogonally to SF maps (green dashed lines: iso-orientation contours; purple dashed lines: iso-SF contours); an extensive range of SFs are available to each orientation. In comparison, color domains tend to have more spatial overlap with low SF preference domains and avoid overlap with high SF preference domains. In color domains, another orthogonal relationship exists between hue (dotted lines with different colors: iso-hue contours) and brightness (blue dashed lines: iso-brightness contours).
However, there remain many unsolved questions about how extrastriate areas in primate visual cortex code this fundamental information. Whether there are systematic associations between SF and other parameters in extrastriate areas, such as V2 and V4, is not known. Based on previous results reported in V1, the team predicted that in each area (1) the range of SF associations shift with the topographic location of the ‘hypercolumn’ (Figure 1A), (2) orientation-selective regions have a range of low (light gray) to high (dark gray) SF representation; iso-SF contours (purple dashed lines) map orthogonally to iso-orientation contours (green dashed lines), and (3) color-selective regions exhibit an association with a range of low SFs (light gray, Figure 1B).
To address this proposal, they imaged V2 and V4 of macaque monkey via intrinsic signal optical imaging (ISOI) with large cortical fields of view that contained sufficient territory to allow comparisons of functional organization at a range of eccentricities.

Figure 2. Experimental parameters. (A) Visual stimuli. (B) Diagram of imaging site in the right hemisphere. L: lateral; A: anterior. (C) Lower-left visual field. Black dot: fovea. Horizontal (red) and vertical (blue) lines mapped in (D). (D) Schematic mapping of lines in (C) in V4 (corresponding to the orange disc in B).

Figure 3. Two examples of overall spatial frequency (SF) preference in visual cortex.
(A, E) Blood vessel map of the imaged region for cases 1 and 2, respectively. (B, F) SF preference maps for cases 1 and 2, respectively. Different colors represent different SF preferences (see color bar at top). (C, G) The coverage ratio of SF preference in each visual cortical area (light gray: V1; medium gray: V2; black: V4). (D, H) Mean ± SD for the preferred SF of all pixels across V1, V2, and V4. ***Kolmogorov–Smirnov test, p<0.001.
Firstly, they compared the responses to different SFs (see Figure 2) among different cortical areas. They found that most of the imaged V1 region favored high SF stimuli, while most of the imaged V4 region favored low SF stimuli. The preferred SFs significantly decrease from V1 to V4, consistent with previous findings (see Figure 3).
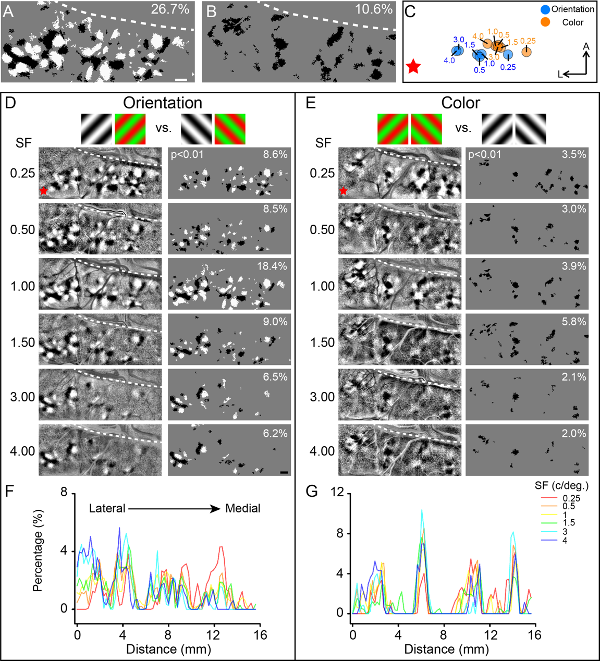
The large-scale imaging makes it possible to capture highly structured maps of functional domains and reveal changes to those maps for different SF conditions (see Figure 4). They found that independent of the type of visual information presented (orientation or color), parafoveal regions tend to process the visual input containing relatively low SF components, while visual input containing high SF components is better processed in foveal regions (see Figure 5). In V4, the foveal region is capable of processing visual information with a broad range of SF sensitivity (see Figure 4A, B). The results also show that, when only a few SFs are tested, the coverage ratio of the orientation and color domains is underestimated, underscoring the importance of testing a wide range of SFs.

Figure 4. Comparison of the functional maps obtained at different spatial frequencies (SFs).
(A, B) Combined results generated by superimposing pixels in (D) and (E), respectively. (C) Selective activation centers of the activated orientation domains (blue dots) and color domains (orange dots) under different SF conditions. (D) V4 orientation (45° vs. 135°) maps and corresponding activated regions for different SFs. (E) Color maps and corresponding activated regions for different SFs, acquired from the same case in panel (A). (F, G) Activated area histograms along the M-L axis generated from (D) and (E), respectively.

Figure 5. The percentage of selectively activated domains change according to spatial frequency (SF).
(A) Demonstration of cortical blood vessel map and the visual areas chosen for analysis. (B, C) The proportions of activated functional domains in the lateral and medial parts of V4 (color: orange, from four experiments in three hemispheres; orientation: blue, from seven experiments in five hemispheres) change according to SFs.
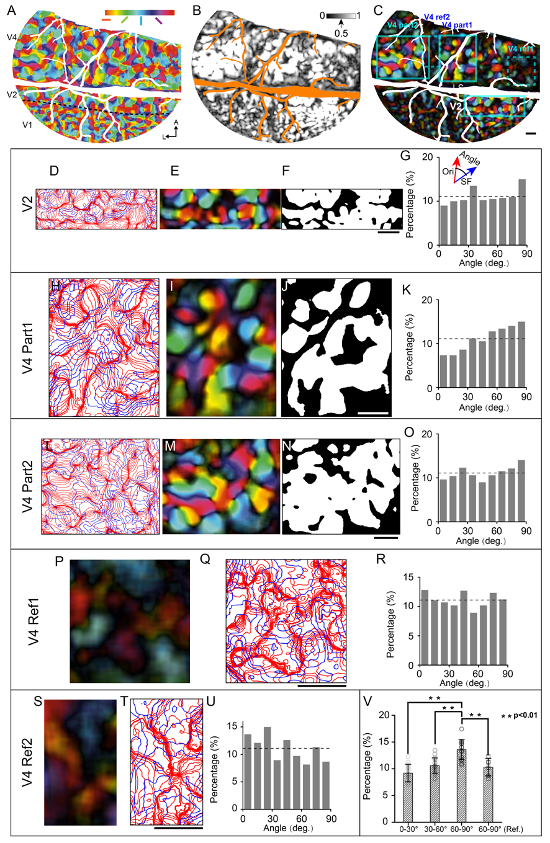
Having obtained orientation and SF preference maps from the same cortical region, it becomes possible to analyze the spatial relationships between these maps. They found that in V2 and V4, the iso-orientation and iso-SF contours that intersected at large angles (>60 degrees) were found most frequently (see Figure 6).

Figure 6. Relationship between spatial frequency (SF) and orientation maps in V4 and V2.
(A) Orientation preference map. (B) Orientation selectivity map. (C) Selectivity thresholded orientation preference map (combined result from A and B). (D, H, L, Q, T) Iso-orientation (red lines) and Iso-SF gradient contours (blue lines). (E, I, M, P, S) Selectivity thresholded orientation preference maps corresponding to (D, H, L, Q, T). (F, J, N) Regions (white parts) with high orientation selectivity (normalized orientation selectivity > 0.5) selected for calculating the intersection angle. (G, K, O, R, U) Distributions of intersection angles of the selected regions. (V) Percentage comparison (Wilcoxon rank-sum test) among different angle groups (0–30°, 30–60°, and 60–90° of strong orientation-selective regions, n=15, and 60–90° of weak orientation-selective regions: 60–90° [“Ref.”], n=6). Error bar: SD. Scale bars: 1 mm.
Finally, they compared the spatial relationship of color domains with SF domains. They found a great tendency for low SF domains to overlap with color domains in both V2 and V4. In V2, similar to color preference, SF preference vary along the V1/V2 border periodically (see Figure 7).

Figure 7. Relationship between spatial frequency (SF) and color-selective domains.
(A–D) Relationship in V4 that high SF domains tend to avoid color domains. (A) Differential SF map. (B, C) Overlay of color domains (orange) and SF domains (gray). (B) Low SF domains; (C) high SF domains. Scale bar, 1 mm. (D) The percentage of HSF/LSF (high spatial frequency/low spatial frequency) selectivity regions within color domains was calculated. (E–M) Relationship in V2 that stripe-like distribution of SF preference changes periodically. (E) Color map. (F) Differential SF maps. (G, H) Enlarged color maps from regions 1 and 2. (I, J) Enlarged SF maps from regions 1 and 2. (K, L) Changes of color-selective response (black lines) and SF preference (red lines) along the path parallel to V1/V2 border in V2. (M) Similar to color selective responses in V2, SF preference changes along V1/V2 border.
In summary, this study shows that in orientation regions, low to high SF is mapped orthogonally to orientation; in color regions, which are reported to contain orthogonal axes of color and lightness, low SFs tend to be represented more frequently than high SFs. This supports a population-based SF fluctuation related to the ‘color/orientation’ organizations. Based on these results, Roe and Hu propose a generalized hypercolumn model across cortical areas, comprised of two orthogonal parameters with additional parameters. They suggest the architecture of SF representation, which describes distinct SF representations within orientation and color regions, further extends and supports the view of continued parallel streaming of feature-specific pathways.
This research was conducted at Zhejiang University and was supported by the China Brain Initiative (grant no. 2021ZD0200401 to AWR), National Key R&D Program of China (grant no. 2018YFA0701400 to AWR), the National Natural Science Foundation of China (grant nos. 31627802, U20A20221, and 81961128029 to AWR; grant no. 32100802 to JMH), China Postdoctoral Science Foundation (grant no. 2020M681829 to JMH), and the MOE Frontier Science Center for Brain Science & Brain-Machine Integration, Zhejiang University. Zhang Ying is the first author. Prof. Roe, associate PI Hu and Prof. Schriver are the corresponding authors.
原文链接:https://www.nature.com/articles/s41531-022-00437-1
脑类淋巴系统是大脑中的排毒系统,通过组织间隙与血管周间隙(perivascular space, PVS)之间的液体交换,清除脑内代谢废物及毒素。研究表明脑类淋巴系统帮助清除与神经退行性疾病相关的神经毒性蛋白(如阿尔茨海默病相关的β-淀粉样蛋白、PD相关的α-突触核蛋白)。脑类淋巴系统清除功能受损,可能导致并加重病理性α-突触核蛋白的沉积,从而对多巴胺能神经元产生损伤,诱发或加剧PD的症状。因此,评估淋巴系统的整体功能可进一步阐明PD的病理生理机制,有助于寻求可能的治疗目标和治疗策略。
早期脑类淋巴系统的研究多集中在动物模型上,受限于安全性及技术可行性,用于评估人体脑类淋巴系统功能的指标相对缺乏。目前神经成像技术的快速发展,为在体脑类淋巴系统检测提供了安全无创的研究手段。血管周间隙扩散张量成像(diffusion tensor image along the perivascular space, DTI-ALPS)是一种可用于无创评估脑类淋巴系统功能的方法,通过测算PVS内水分子的扩散,间接反映脑类淋巴系统的功能改变。同时,可通过计算相关脑区的PVS负荷评估脑内类淋巴系统的结构改变。近年来发展起来的高磁场强度7.0T MRI能获取高分辨率与高信噪比图像,从而获取更精准的信息。赖欣怡课题组通过超高场强7T MRI技术研究PD患者脑类淋巴系统功能及结构的改变,探究脑类淋巴系统损伤与PD临床症状的相关性,阐述脑类淋巴系统受损是否与PD发生发展相关。

首先,课题组采集T2加权磁共振成像(T2WI)数据,分别对左右侧半球基底节区的PVS负荷的数量及体积进行定量,获得PVS负荷评估指标。随后利用多波段回波平面弥散加权成像,分别进行左右脑侧脑室旁的DTI-ALPS指标的计算。研究发现,与健康对照相比,PD组在疾病早期时,左侧大脑半球的DTI-ALPS指数显着降低;在疾病中晚期时,双侧大脑半球的DTI-ALPS指数均显着降低。与临床数据进行关联分析时发现,右侧大脑半球的DTI-ALPS指数与UPDRS-III及UPDRS总分负相关;左侧大脑半球的DTI-ALPS指数与疾病病程及LEDD负相关。同时针对PVS负荷指标,课题组发现与健康对照相比,PD患者的右侧基底节区PVS数量及体积均显着升高。同时对两个指标进行关联分析,发现右侧大脑半球的DTI-ALPS指数与同侧的PVS数量及体积呈显着负相关。

根据研究结果推断,PD的DTI-ALPS指数下降所反映的脑类淋巴系统功能改变可能具有偏侧性特征,起始于左半球并随着疾病的发展逐渐累及右半球。且DTI-ALPS指数的降低与PVS负荷的增加相关,表明这两个指标可以互相补充,分别从功能和结构的角度反映脑类淋巴系统的损伤情况。可见,这两个脑类淋巴系统的MRI评估有望成为评估PD病程进展的影像学标志物。
浙江大学医学院系统神经与认知科学研究所博士后沈婷及浙江大学医学院附属邵逸夫医院神经内科岳玉梅医生为共同第一作者,浙江大学医学院系统神经与认知科学研究所赖欣怡教授、浙江大学医学院附属第二医院张宝荣教授及浙江大学医学院附属邵逸夫医院吕文教授为共同通讯作者。本研究得到国家重点研发计划、国家自然科学基金面上项目、国家自然科学基金国际(地区)合作与交流项目、浙江省科技计划项目、中央高校基本科研业务费专项资金资助、之江实验室等的资助。

图:赖欣怡教授研究团队成员合影
(从左到右:谭晓君,徐玉,渠博艺,沈婷,赖欣怡,岳玉梅,余晓,何婷婷,王海铭)
Link: https://www.sciencedirect.com/science/article/pii/S266723752200248X
Currently, a hot new direction in nonhuman primate research is the study of brain activity during natural behaviors. In vision studies, traditional approaches employed head restraint and unnatural or fixed looking behaviors and covert attention paradigms. Now, with the advent of new technologies and greater computational methodologies, overcoming these challenges are becoming feasible. This study provides a step towards this direction by making strides in use of miniaturized components, wireless technology, and adaptable interface with existing windows on the brain in nonhuman primates, all at relatively low cost. Towards developing a wireless methodology for inducing changes in visual perception in NHPs, we present a wireless optogenetic stimulator for neuromodulation of cortical activity. This is coupled with an on-head optical imaging system outfitted with a miniature camera for monitoring functionally specific changes in visual cortical activity during optogenetic neuromodulation. This system is currently used to study brain activity in monkeys sitting in a primate chair without head restraint and comprises a significant step towards studies of neural circuits underlying natural looking behavior.
Here, we describe an optical imaging and stimulation device for use in primates that easily attaches to an intracranial chamber. It consists of affordable commercially available or 3D printed components: a monochromatic camera, small standard lens, wireless µLED stimulator powered by an induction coil, and an LED array for illumination. We show that the intrinsic imaging performance of this device is comparable to a standard benchtop system in revealing the functional organization of visual cortex for awake macaques in a primate chair or under anesthesia. Imaging revealed neural modulatory effects by wireless focal optogenetic stimulation aimed at identified functional domains. By offering a 1-2 cm field of view, 100x larger than previously used in non-head restrained primates, our device demonstrates the feasibility for widefield optical imaging and optogenetic stimulation for future ethological studies in NHPs.

Figure caption: Illustration of instrumentation and methodology. At leftis depicted (1) the head-mounted miniature optical imaging CCD camera (3cm in size), (2) with red and green illumination microLEDs, (3) adapter collar (gray) for mounting on the (4) optical chamber that is secured to the skull (black), (5) removable wireless stimulator that inserts into chamber, and (6) artificial dura hat that protects the cortex. Red circle: location of chamber on monkey head overlying 2 cm region of visual areas V1, V2, and V4 on the monkey brain. At top rightare views of what is seen by camera in the window (red circles). The view on the left shows an orientation map revealing orientation domains in V1, orientation stripes in V2, and orientation bands in V4. The solid line is the lunate sulcus and the dotted line the V1/V2 border. The view of the right shows viral expression of channelrhodopsin following injection of viral vector AAV into selected locations. Also depicted is the optogenetic activation via blue light through the wireless stimulator powered by an induction coil positioned over the head (represented by curved blue lines at top right). The lower rightschematic depicts the wireless optogenetic stimulation of a single functional domain (e.g. orientation, color, motion and disparity domains are represented by colored discs). Activation of one domain in turn activates other connected functional domains in V2 and V1 (cf. Hu et al 2022 Curr Biol 32:2797-2809.e3). We show this method achieves neuromodulation of the local mesoscale cortical circuit (via minicamera imaging of activated networks during stimulation) and is aimed at achieving simultaneous behavioral modulation in the freely behaving monkey.
浙江大学系统神经与认知科学研究所奚望副研究员,Anna Wang Roe教授以及浙江大学光电学院钱骏教授团队合作开发了一套适用于猕猴脑部皮层活体大深度成像的三光子荧光显微成像系统、配合相应的成像探针,实现了当前活体猕猴脑部多光子荧光显微成像的最大深度。相关成果以标题为“Large-depth three-photon fluorescence microscopy imaging of cortical microvasculature on nonhuman primates with bright AIE probe In vivo”于近期(2022.10)发表在Biomaterials(IF=15.304),文章链接:https://doi.org/10.1016/j.biomaterials.2022.121809。文章的第一作者为浙江大学系统神经与认知科学研究所博士后张鹤群,共同第一作者为博士生付鹏和研究助理柳荫。系统所多光子成像平台为本文提供了技术支持。浙江大学系统所副研究员奚望、Anna Wang Roe教授以及光电学院钱骏教授为本文的共同通讯作者。

非人类灵长类动物,由于其和人类的基因和解剖结构更为接近,研究其脑部活动对于了解人类脑功能具有重要意义。多光子荧光显微成像技术作为先进的活体脑成像手段,可以在脑部接近无损的条件下进行毫米量级的较大深度成像,为实时研究脑部神经活动和血管结构提供了可能。对比当今较为成熟的双光子显微技术,在活体猕猴皮层的成像深度,还停留在500-600 μm,限制了其在更深层皮层结构上的使用。利用更为先进的三光子显微系统,可以提高成像的穿透深度,获取更深层脑组织的信息,但是在活体猕猴脑部成像领域,尚缺少大深度三光子荧光显微成像的工作。
本工作利用实验室自主搭建和优化的多光子荧光扫描显微系统,在高亮度AIE纳米颗粒探针的辅助下,首次在猕猴这一非人灵长类模式动物上,实现皮层血管的大深度(~1000 μm)三光子荧光显微成像。首先,通过实验室搭建和优化的成像系统,配合色散补偿的1300 nm波段的飞秒激光,可以实现高效的三光子荧光激发。在此基础上,通过同步采集等手段,保证了猕猴活体成像中,荧光信号的稳定采集。利用合作单位提供的高效AIE探针,采用静脉注射的方式标记了猕猴血管,并在活体情况下对脑皮层精细至毛细血管的血管结构进行了局部记录,成像深度高达980 μm。在此基础上,对血管结构进行了提取和建模分析,对不同模式动物(小鼠、猕猴)的血管结构参数,进行了数值化对比。利用此系统还可以采集血流的动态信息,对不同深度的血流速度进行检测。实验结果初步验证了猕猴和小鼠在血管结构分布上具有明显的差异,猕猴血管沿功能柱的轴向分布更为明显,而小鼠血管在轴向和横向上的分布都更为平均。研究结果为活体情况下研究猕猴脑部精细结构和功能提供了一个有潜力的成像手段,给在更深部脑区进行成像和研究提供了可能性。

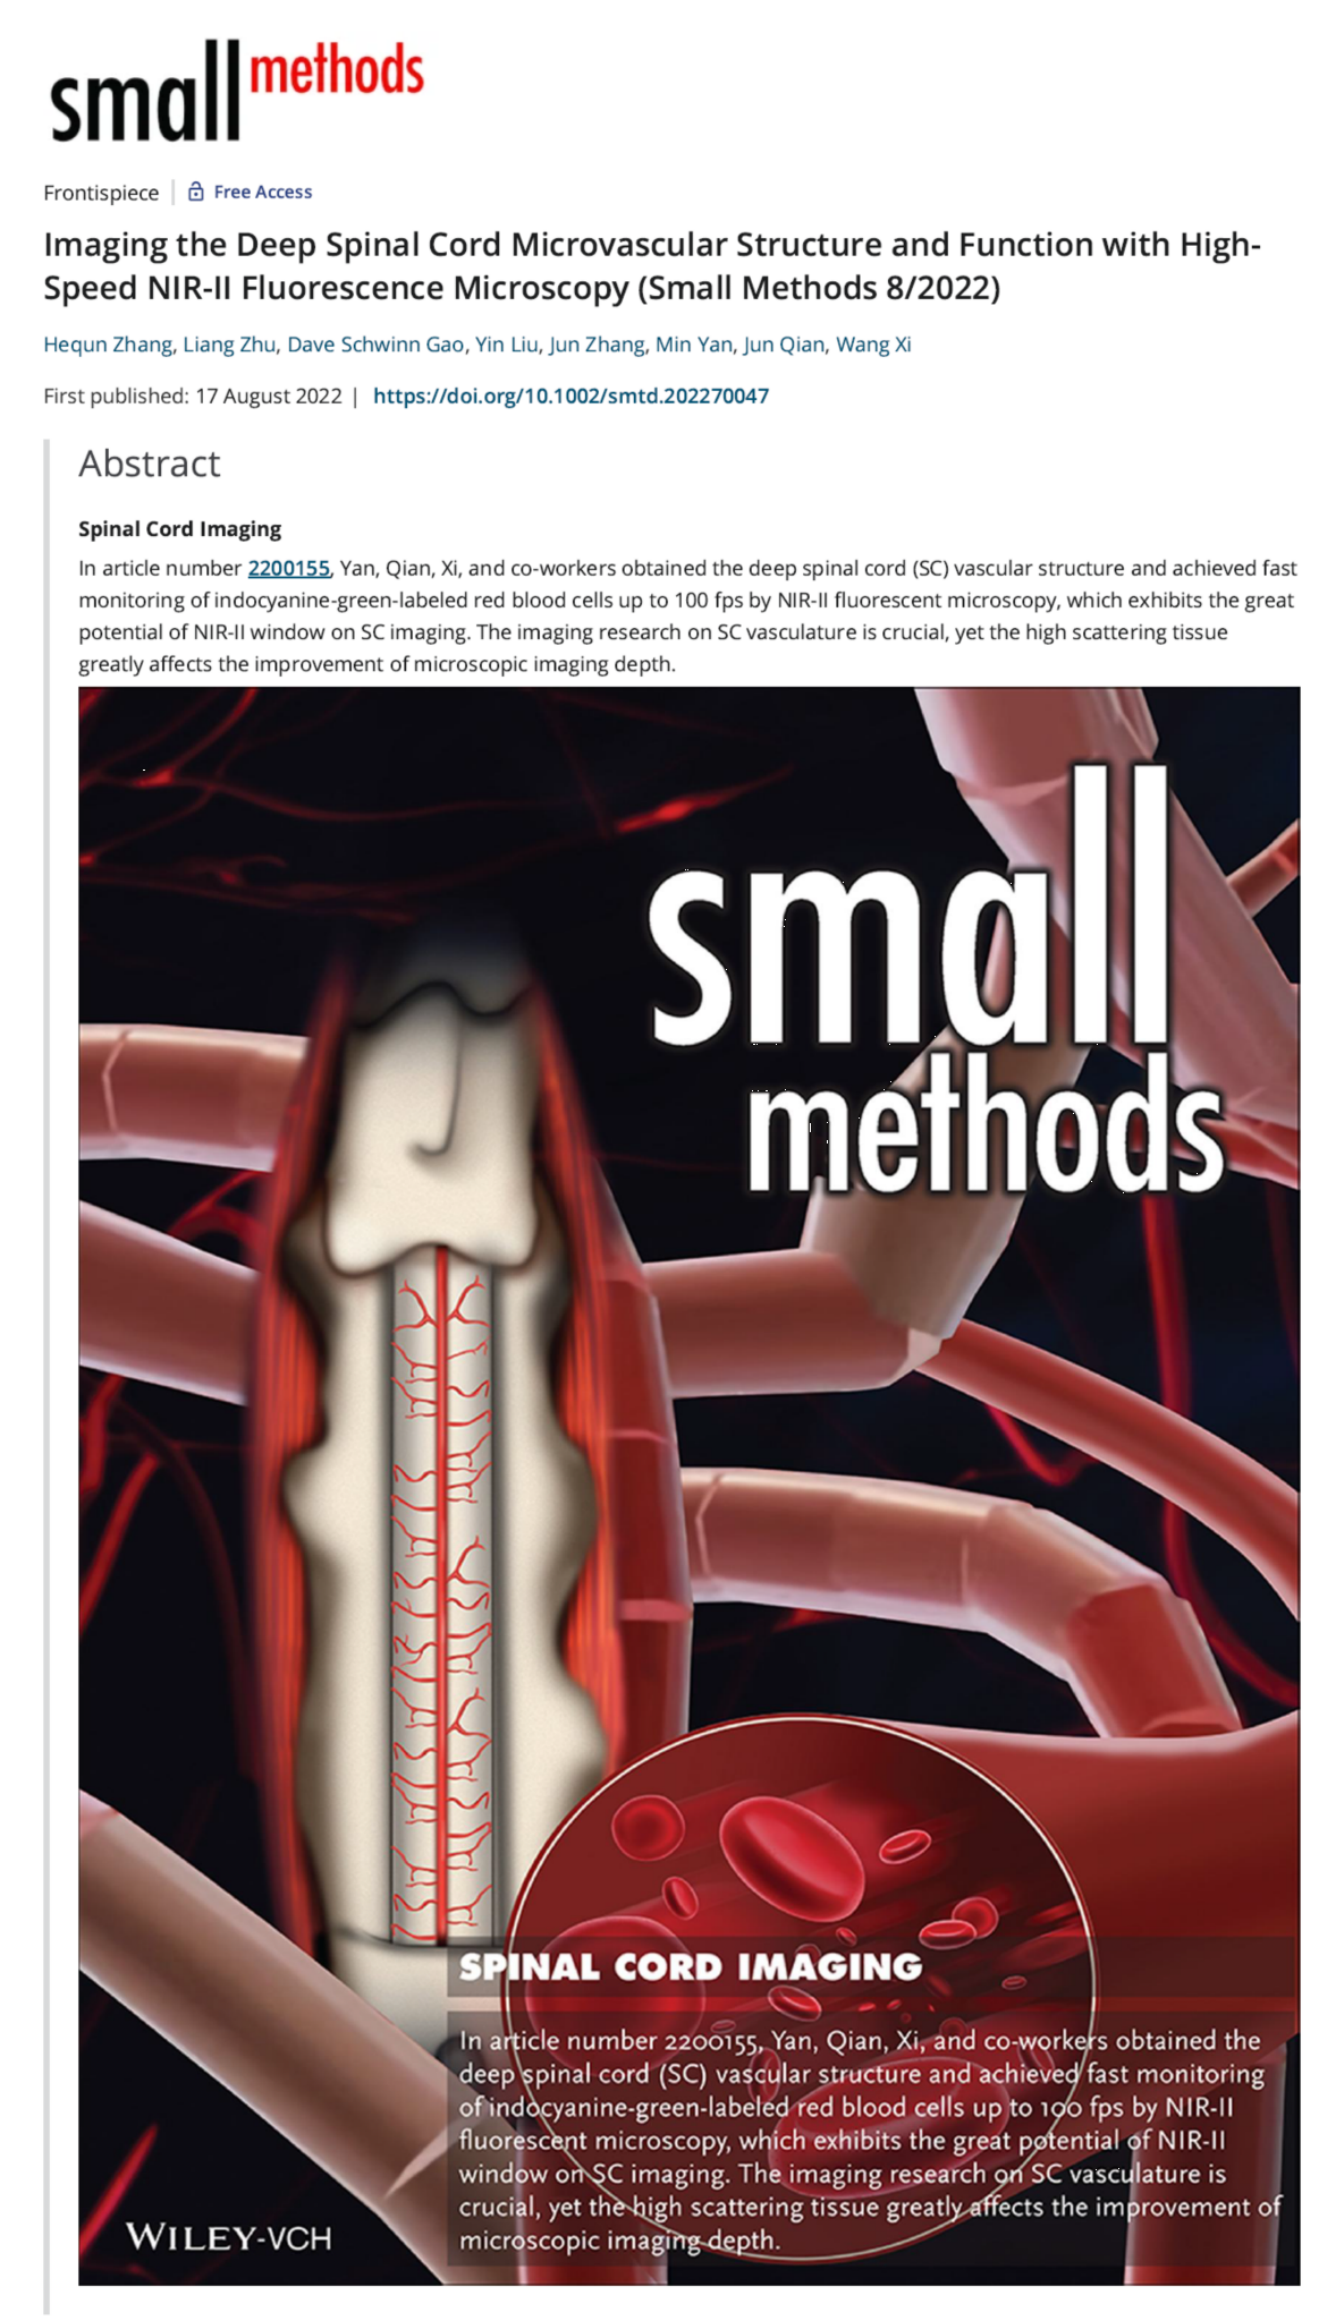
课题组近期(2022.08)张鹤群博士后、朱亮博士生还在Small Methods(IF=15.367)上发表一篇标题为“Imaging the deep spinal cord microvascular structure and function with high-speed NIR-II fluorescence microscopy”的文章。文章作为该期卷首插页推荐。该工作基于商用显微镜框架设计和搭建了一套集单光子/多光子/红外二区(NIR-II)荧光成像于一体的多模式成像系统。利用该系统,配合ICG标记的血红细胞及NIR-II染料,实现了小鼠脊髓血管的大深度(~350 μm)结构成像以及高速流动血红细胞的监测(100 FPS)。并通过该成像手段探究了同侧和对侧腿部电刺激过程中,脊髓血流速度变化趋势的异同。

文章的第一作者为浙江大学系统神经与认知科学研究所博士后张鹤群,共同第一作者为博士生朱亮,系统所多光子成像平台为本文提供了技术支持。浙江大学系统所副研究员奚望、光电学院钱骏教授以及医学院附属第二医院严敏教授为本文的共同通讯作者。
相关工作受到科技部2030重大计划,国家自然科学基金,浙江省领雁计划,浙江省自然科学基金,中央高校基本科研基金等基金资助,以及浙江大学脑与脑机融合前沿科学中心、浙江大学生物医学工程教育部重点实验室等大力支持。